Evaluation of Steel Pipe Pile Length Performance in Sand Based on Load Test Results
Associate Proffessor, Department of Civil Engineering,
The Islamic University of Gaza, Palestine
mawad@mail.iugaza.edu
ABSTRACT
The main objective of this research was to study the effect of pile length on total pile resistance driven into dense sandy soil. Axial compression tests were performed on closed-ended steel pipe piles. The calculated resistance’s using American Petroleum Institute method and Alawneh proposed approach are compared with measured pile resistances. A relationship between the volume of displaced soil and ultimate pile resistance is proposed. A selection of five methods of estimating the failure load in pile loading tests is examined. From the results of the study of 15 pile loading tests, a method is proposed for estimating failure loads for driven pile in sandy soil.
KEYWORDS: Pile length, Loading tests, Interpreted ultimate loads, Volume of displaced soil, Sand.
INTRODUCTION
Evaluation of pile bearing capacity is still a subject of many researchers. Several researchers mentioned that, the calculated pile bearing capacity by conventional methods often give poor agreement with the load test results (Awad 2002, Foray 1998, Lings 1997, Randolph et al. 1994, Kraft 1991, and Briaud and Tucker 1988). Many tests have been carried out with instrumented piles to measure the variation of an axial pile load with depth (Lehane et al, 1993). However very little reliable data for the pile behavior in dense sand is available (Chow 1995). It is also well recognized that, considerable uncertainty remains in interpreting the failure load of a pile-loading test. A number of different failure criteria is considered in literature and that are in use in specifications around the world (Ng et al. 2001).
With the objective to better understand the influence of the length of piles driven in sand, field tests were performed at Islamic University of Gaza Campus, as part of a research program. This paper describes a full-scaled load tests closed-ended steel pipe piles with two diameters and different length driven in dense sand. In the experimental program, the sandy soil was prepared to impose homogenous boundary conditions that controlled the soil mass surrounding the pile. This allows for the elimination of the boundary factors effects in pile bearing capacity results.
CRITICAL-DEPTH CONCEPT
The concept of the critical-depth can be defined as: below which the unit shaft and tip resistances are assumed to be remained constant. Kulhawy (1984) pointed out that this concept is commonly attributed to Vesic. Meyerhof and Nordlund methods for analysis of bearing capacity apply the critical-depth concept. Lehane et al. (1993) show evidence of a limiting value of average shear stress beyond a critical depth thereafter remains roughly constant. This critical-depth concept has also been used by Vesic (1970) and Tavenas (1971) (quoted from Robert 1997). Some recent textbooks pointed that the effective vertical stress achieves a maximum value at a critical depth of some 10 to 20 pile diameters (Das 1995). It should be mentioned that Karft (1991) and Kulhawy (1984) are concluded that the unit tip and shaft resistances of the pile do not reach a limit at a critical depth, which is not in agreement with Meyerhof and others. Foray (1998) pointed out that, there is no limiting values for both unit end bearing and shaft friction resistances for piles driven in sand up to 80 m depth. On the other hand, comparison of bearing capacity calculation methods indicates that Hansen, and American Petroleum Institute (API) methods take into account a limiting effective stress, regardless of the pile diameter; while the general shear method and Jambu method ignore this stress. Randolph et al. (1994) has attributed these contradictions to the limited database of field scale pile load tests, and lack in the soil data.
SOIL CONDITIONS
The site is located close to the southwest corner of the university campus. The soil at the site is composed mainly of two layers sand and clay. To achieve a high degree of uniformity of sand layer through the pile embedded depth, the site was excavated up to a depth of 6 m. Then it was filled with fine to medium sand. The fill was compacted in layers of 0.3 m each using a vibratory compactor of 2-ton capacity. At each layer the site was flooded with water before compaction. The average relative density is 90%. The average bulk unit weight is 18.1kN/m3. The internal friction angle (F) was measured as 35 degrees using a shear box test.
Figure 1 shows the soil profile. The sand layer may be classified according to unified soil classification system as poorly graded sand (SP). Shear box test was performed using steel plate (represents the pile material) in the upper half of the shear box and the sand soil was placed in the lower half with the same field density. The internal friction angle between pile material and the sandy soil was found as 27 degrees.

Figure 1. Soil profile.
LOADING TEST ARRANGEMENT
Four steel pipe piles with two diameters (11.2 and 21.6 cm) were driven at the Islamic University of Gaza. For each diameter, the pile was tested at two locations. Fifteen pile load tests were performed. A plain view of the site with the location of the pile test is shown in Figure 2. During installation of the piles, load tests were carried out at different penetration depth intervals of the same pile. Welding makes insertion of the next part of the pile with the previous one; three steel bars are welded in the upper internal zone of the pile to insure the verticality of the pile during and after welding. The steel frame arrangement was described in detail elsewhere, Awad (2002) and therefore it is not going to be presented here. The piles were driven using a truck-mounted drilling rig as a hammer facilitated a full length pile driving. The test piles were positioned between six reaction piles. These reaction piles were cast-in-place with 0.4 m in diameter and 12 m in length.

Figure 2. Pile test locations
All pile load tests were performed in almost a uniform soil conditions, using a high capacity hydraulic jack and dial gauges accurate up to 0.01mm to measure the axial movement of the pile head. The pile was manufactured using steel tubes. The piles have an outer diameter of 11.2 cm and 21.6 cm and are closed-ended with 60-degree cone. Figure 3 illustrates a schematic arrangement of the test system.

Figure 3. Pile test arrangements test.
TEST PROCEDURE
A calibrated pressure gauge and hydraulic jack system were used to apply the compressive load. The axial compression load tests were performed in accordance with ASTM D-1143 approximately within one week after the piles were driven and one month after compaction. The tests were performed in relatively dry sand material with water content of 3.6%. The pile movements were measured with three dial gauges rested on a rigid plate, 3 mm thick, which was positioned on the pile head, and connected to two reference beams installed adjacent to two sides of the pile. The axial load was applied in equal increments 10% of the expected maximum load, every 20 minutes.
ULTIMATE LOAD ESTIMATION
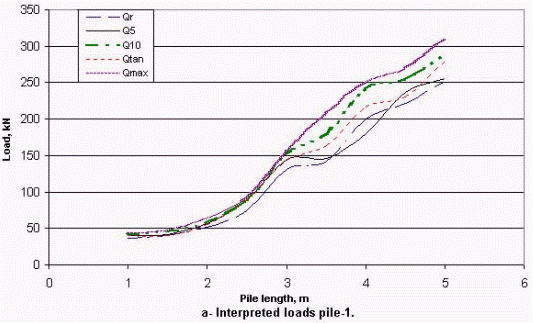
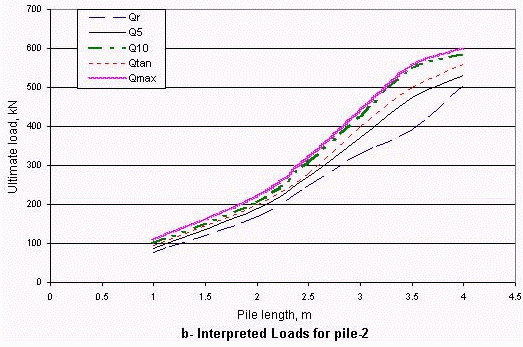
There are various interpretation procedures to determine the ultimate load of a pile from the pile load test results (Ng et al. 2001). In practice, the ultimate load of the pile can be defined as the applied load at pile top, when the pile head movement is equal to 10% of the pile diameter. The ultimate can also be defined as the point at which the linear zone after curved (transition) zone goes into the steeply falling part. These are some definitions among many. Figure 4 shows the results of pipe pile with 21.6 cm outer diameter test (pile-2). For the rest piles, a ratter similar behavior was observed. The piles were loaded to the failure (i.e. failure load has been taken as the maximum load causing a pile penetrated at such a rapid rate that the load could not be maintained, Qmax) where the recorded settlement was more than 10% of the pile diameter. In some cases of failure modes, the failure point is difficult to be observed; continuous increase in axial load is required to maintain pile vertical movement. It can be observed from the above mention interpretation procedures that the basic difference is the definition of the failure load. Some of various existing criteria were applied to the test piles under consideration range from 1 to 5 m in length. These results are given in Table 1.
Table 1. Interpreted ultimate loads in kN from pile load test results for Pile-1 and pile-2 groups
| Test No. | Pile Length (m) | Pile with 11.2cm diameter | |||||
| Qr | Q5 | Q10 | Qtan | Qmax | S (mm) | ||
| 1 | 1 | 37 | 40 | 24 | 40 | 44 | 20.9 |
| 2 | 1.5 | 40 | 42 | 45 | 40 | 48 | 16.5 |
| 3 | 2 | 52 | 57 | 58 | 54 | 64 | 28.1 |
| 4 | 2.5 | 74 | 88 | 90 | 88 | 92 | 15.6 |
| 5 | 3 | 131 | 145 | 152 | 144 | 156 | 14.7 |
| 6 | 3.5 | 142 | 146 | 180 | 164 | 208 | 17.4 |
| 7 | 4 | 200 | 180* | 242 | 216 | 250 | 12.4 |
| 8 | 4.5 | 176 | 237 | 254 | 230 | 270 | 24.3 |
| 9 | 5 | 252 | 256 | 288 | 280 | 310 | 18.1 |
Table 1. (Concluded).
| Test No. | Pile Length (m) | Pile with 21.6cm diameter | |||||
| Test No. | Pile Length (m) | Qr | Q5 | Q10 | Qtan | Qmax | S (mm) |
| 10 | 1 | 76 | 86 | 99 | 96 | 108 | 37.8 |
| 11 | 2 | 170 | 189 | 206 | 200 | 220 | 38 |
| 12 | 2.5 | 248 | 273 | 307 | 280 | 320 | 26.3 |
| 13 | 3 | 330 | 372 | 427 | 400 | 440 | 24.6 |
| 14 | 3.5 | 392 | 474 | 550 | 500 | 557 | 33.5 |
| 15 | 4 | 504 | 532 | 585 | 560 | 600 | 26.6 |
TEST RESULTS
In order to investigate the effect of the pile length on the pile resistance, a series of field tests were carried out. The tip and shaft pile resistances are generally treated independently in design, although Kezdi (1957) stated that these two components are interdependent (quoted from Robinsky and Morrison 1964). Alawneh et al (2001) and Robert (1997) have also pointed out that residual stresses (loads which are present in the piles due to driven process and before starting the load tests) have little influence on the measured total capacity of the pile. Therefore, in this study the results for the test piles are recorded as total pile capacity. The results are separated into two groups according to the pile diameter. The test results for two diameters of steel pipe piles were plotted in Figure 5. An examination of this figure together with Table 1 shows that the measured pile load capacity was increased with increasing pile length; there was an overall similarity in trend of interpreting ultimate loads performance of the test piles in sandy soil with increasing pile length. For the driven test piles with two diameters, the limiting value has not been reached; although the total capacity of pile-2 continue to increase with increasing depth, with decreasing rate at depth of 16 times the pile diameter. It is worth noting that total capacity rate of pile-1, with smaller diameter, continue to increase with increasing depth although the depth to pile diameter ratio reach to about 45. Therefore, overall, the concept of critical-depth is not obtained in the range of the test piles length.

Figure 4. Measured load versus head movement for pile-2 with 3m length


Figure 5. Measured total pile resistance versus pile length.
VOLUME OF DISPLACED SOIL EFFECT ON TOTAL PILE CAPACITY
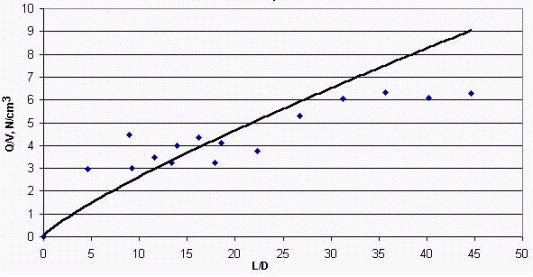
The driving of a pile in sandy soil creates a compacted soil zone in the vicinity of the pile. The volume of the displaced soil by the pile will affect the extent of this compaction zone and the properties of the soil material. The calculated pile capacity should be based upon the properties of the soil after the piles have been driven. Robinsky and Morrison (1964) have studied the compaction of sand around and beneath the pile, which shows a complex sequence in density changes. It is also difficult to measure the soil properties after pile driving. It is become that the volume of displaced soil by a pile is an important parameter in determining its load carrying capacity Lings (1997). Therefore with the available test results, an attempt has been made to produce empirical design equation for predicting total pile capacity. The ratio of total capacity to the volume of displaced soil for each pile test has been plotted against penetration ratio (pile embedded depth to pile diameter) in Figure 6. For ease in comparison, the data shown in Figure 6 were analyzed with maximum failure load (Qmax) as the ultimate load. These data were analyzed using a statistical regression program. Using the least squares fit for a curve through points to obtain the following correlation equations: Qmax /V= 0.3916(L/D) 0.8263 with R-square value of 0.9763 (1a) Qtan /V= 0.3016(L/D) 0.8044 with R-square value of 0.9817 (1b) Where R-square value is coefficient of determination that indicates an acceptable degree of accuracy; the coefficient of determination is a measure that is used to determine the relative correlation between two sets of variables, V is the displaced soil volume in cm3, Q in Newton, L is the pile length in m, D is the pile diameter in m, and L/D is expressed as a ratio. This method considers the influence of soil displacement on total pile capacity. Also, the pile length was nondimensionalized by using the penetration ratio. It should be emphasized that, equation (1) is based on load test results of uniform cross section steel pipe closed-ended pile and driven in a uniform soil with an average friction angle 35 degrees and unit weight of 18.1kN/m3. With this correlation equation, it would be possible to predict the total ultimate pile capacity within the range of penetration ratio analyzed.

Figure 6. Ratio of the ultimate of total pile resistance to volume of displaced soil versus penetration ratio.
Table 2. Summary of R-squares of closed-ended steel pipe piles driven in sand.
| Equation type | ||||||||
| Authors | References | PN | Linear | Power | Logarithm | Exponential | Polynomial | Remarks |
| Awad (1) | This study | 15 | 0.7148 | 0.9817 | 0.6065 | 0.3555 | 0.7256 | USL |
| Awad (2) | Awad 2002 | 5 | 0.9837 | 0.987 | 0.9778 | 0.9569 | 0.9858 | USL |
| Vesic (3) | Robert 1997 | 5 | 0.2109 | 0.4561 | 0.3796 | 0.2717 | 0.5874 | |
| Mansur (4) | Alawneh 2001 | 3 | 0.9988 | 0.9977 | 0.9947 | 0.9999 | 1 | |
| Nordlund (5) | Robert 1997 | 3 | 0.3889 | 0.4296 | 0.4212 | 0.3972 | 1 | |
| Rows (1+2) | 20 | 0.7674 | 0.9802 | 0.4971 | 0.2962 | 0.7728 | ||
| Rows (1+2+4) | 23 | 0.214 | 0.8321 | 0.2286 | 0.1672 | 0.2318 | ||
Q/V-RELATION VALIDITY
A database of 31 compression load test of closed-ended steel pipe piles driven in sand was gathered from the literature and this study to carry out statistical analysis; twenty of them were driven in almost uniform sand layer. Table 2 summaries the statistical results of overall analysis. The five equation types were based only on two main variables Q/V and pile penetration ratio in this work. The equation types are linear, power, logarithm, exponential, and polynomial with 2 orders. Each group of pile load tests includes a number of piles (PN) equal to or greater than 3 piles. R-squares were calculated. The better relation between Q/V and penetration ratio is that has R-square value close to one. By examination of Table 2, it is found that the power equation has the best accuracy with respect to other equations. The given pile load test data by Vesic and Nordlund has shown poor R-square values, while other sites have shown better R-square values.
Equation (1) describes a method that predicts total pile capacity. Overall the agreement with the measured data in the same condition appears to be good, but the method is less satisfactory as far as the other factors associated with the soil and pile parameters are not clearly considered. Generally, in order to achieve more accurate equation, a quite high number of pile load tests in uniform sand layer with wide range of penetration ratio may be required. The method proposed here is very simple to be used. With this correlation equation, i.e., equation (1), it would be possible to predict the pile load capacity within the studied pile length range. It is probably conservative when used with driven steel pipe piles in uniform dense sand layer. To calculate the ultimate pile capacity, many of the pile tests from the available literature with sandy soil sites are used. A uniform soil condition is not encountered in practical site; soil properties show a significant variation in the same site. There is clear evidence that soil uniformity among many other factors affect the correlation of the given data.
DESIGN EQUATIONS
Several methods are currently used in engineering design practice. Some of these methods use laboratory testing to calculate the required parameter values, such as the earth pressure coefficient K, and the bearing capacity factor, Nq. The basic design equation for the ultimate bearing resistance of the pile (Qu) can be expressed as follows:
Qu = Qp + Qs (2)
Kulhawy (1984) pointed that, when the penetration ratio of pile greater than 5, the Ng term in the bearing capacity formula is small compared with Nq term and can safely neglect. Therefor, the tip resistance of pile for sandy soil can be represented by the following equations:
Qp = Ap qpu (3a)
qpu = q\ Nq Fq (3b)
where
Ap =cross sectional area of pile tip,
q\ = effective soil vertical overburden pressure at pile tip,
Nq = pile bearing capacity factor of surcharge component,
Fq = correction factor of surcharge component.
Using the unit shaft resistance as follows; it can represent the shaft resistance of pile:
Qs = As ƒ (4)
where
ƒ = stress of shaft friction (s K tan d),
s = mean effective soil overburden pressure,
As = area of pile surface.
STATISTICAL ANALYSIS
For ease of back calculation, the equation (2) of the axial compression pile capacity can be re-written in the following form: Qu/V = ? Nq + 2? ß (L/D) (5) The soil unit weight (?), Nq and ß that equal to (K tan d) are assumed constant over the length for each pile. Using the least squares fit to obtain the linear representative equation. The analyses were repeated backward for the pile-1 and pile-2 groups, the mean of Nq value was found to be 141 for pile-1 and 128 for pile-2; also ß value was 2.52 for pile-1 and 3 for pile-2.
COMPARISON OF THE RESULTS
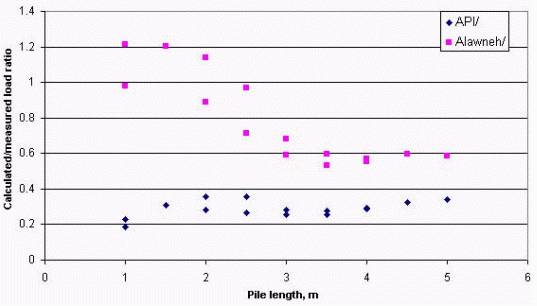
The author tried to predict the bearing capacity of the test piles using the more recent methods that calculated with the geotechnical properties of the soil. Alawneh et al. (2001) proposed approach and the American Petroleum Institute (1993) (API) method were used to predict the bearing capacity of the test piles included in the experimental program. The calculations indicate a significant difference between these two methods. A comparison between calculated using Alawneh et al. (2001) approach and API method and measured total pile capacity for the piles used in this study is shown in Figure 7. The results determined using Qtan criterion is given in parentheses in bold. API results are distributed below the equality line, with a mean of calculated to measured pile capacity ratio equal to 0.29 (0.33) and standard deviation of 0.05 (0.055). The minimum and maximum ratios are 0.19 (0.21) and 0.36 (0.41) respectively. It can be seen that when pile length less than 2.5m Alawneh et al. (2001) calculated to measured ratio appear to be distributed above and below the equality line with an average of 1.014 (1.14) and standard deviation of 0.18 (0.23). By increasing the pile length, the calculated to measured ratio becomes below the equality line with an average of 0.59 (0.67) and standard deviation of 0.044 (0.06). Briaud and Tucker (1988) have made a statistical analysis for 8 piles driven in sand, the ratio of the calculated ultimate load over the measured ultimate load (Qc/Qm) were calculated; the average value of (Qc/Qm) using API method was 0.42 with standard deviation of 0.16, which is close to the given results of this study. Therefore, Alawneh et al. approach has a tendency to under-predict the ultimate load as the pile length increased. This may be due in part to the limited pile load tests that used in developing the correlation` equation. In another part the assumption of some used parameters in estimating Nq and b.

Figure 7. Ratio of the calculated to measured pile capacity versus length.
DISCUSSION OF THE RESULTS
Comparison of calculated and measured results shows that in general the measured pile capacity is higher than the calculated with the current design methods. Foray (1998) showed that piles driven in dense sand can develop significantly higher capacities than the computed with API method. Foray (1998) has also proposed values for earth pressure coefficient K of an open-ended pile to be between 1 and 2 for very dense sand. So, K value for closed-ended pile is expected to be greater than 2. On the basis of the comparison of (Qc/Qm) using API method, the author proposed to multiply the API predicted ultimate pile capacity by 3 to achieve a practical results. Also recall the ß values, it is found that value for pile-2 is greater than that for pile-1, which is a reasonable result. This is because; the displaced soil volume by pile-2 is greater than that by pile-1, which is leading to denser soil. This is in a good agreement with theory suggests that b increases with an increase in sand relative density. A possible discussion is that a less amount of the displaced soil by driving pile-1 in sand does not densify the sand as much as in the case of pile-2.
CONCLUSIONS
Based on the results of this study, it is concluded that:
The ultimate pile capacity can be predicted at pile head movement of 6% of the pile diameter.
The interpreted load obtained using the residual criterion method was relatively lower than other methods and insensitive to the failure region.
Alawneh et al. proposed approach show better results than API method; it also shows acceptable results with piles length less than 2.5m.
It may be noted that, in general, the calculated of total pile capacity was lower than measured pile capacity.
There is no evidence of the concept of the critical-depth of total pile capacity, in the range of pile length investigated, but a rather increasing of total pile capacity with pile length increasing.
ACKNOWLEDGMENT
The author wishes to thank Eng. Barahmah H, and Ryatti A. for their assisting in performing the tests. Personal thanks go to IUG soil laboratory team and Mr. R. Nasman.
REFERENCES
| © 2003 ejge | |